
GEX Gamma Data is one of the most talked-about concepts in the world of stock market trading. If you’re just getting started with understanding market dynamics, this guide will explain everything about GEX Gamma Data in a way that’s simple, clear, and easy to follow. Whether you’re an investor, a trader, or just curious about how the stock market works, this article will help you grasp the essentials.
What Does GEX Gamma Data Mean?
GEX stands for Gamma Exposure, and it is a key term used in options trading and the stock market. At its core, GEX Gamma Data measures how much exposure market makers have to price movements in the stock market due to their positions in options. Essentially, it shows whether market makers are acting as stabilizers or amplifiers of price movements.
When traders buy and sell options, market makers (who provide liquidity by taking the opposite side of these trades) need to hedge their positions. Gamma Exposure tells us how sensitive their hedging activity is to price changes in the underlying asset. A high GEX means market makers are likely to stabilize prices, while a low or negative GEX suggests they might amplify price volatility.
In simple terms, GEX Gamma Data helps explain why the market moves the way it does—especially during periods of high volatility.
Why Is GEX Gamma Data Important?
GEX Gamma Data is crucial because it gives traders and investors a glimpse into the forces shaping stock price movements. Here are a few reasons why it’s important:
- Market Stability: GEX tells you if market makers are helping to stabilize prices or if their actions could lead to more dramatic swings.
- Predicting Volatility: Understanding GEX Gamma Data can help you anticipate periods of high or low volatility, which is essential for timing your trades.
- Informed Decision-Making: By analyzing GEX, traders can make more informed decisions about entering or exiting trades, especially in volatile markets.
In short, GEX Gamma Data is like a weather forecast for the stock market—it doesn’t guarantee outcomes, but it gives you valuable clues about what to expect.
How Does GEX Gamma Data Work?
To understand how GEX Gamma Data works, you first need to grasp the concept of gamma in options trading.
What Is Gamma in the Stock Market?
Gamma is a measure of how quickly the delta of an option changes as the price of the underlying stock moves. Delta refers to how much the price of an option is expected to change for a $1 move in the underlying stock. Gamma, therefore, is a second-level derivative that shows the rate of change of delta.
When gamma is high, it means the delta of the options is changing rapidly, and market makers need to adjust their hedges more frequently. This can have a significant impact on stock prices.
How GEX Impacts Stock Prices
GEX (Gamma Exposure) represents the combined gamma of all options in the market, weighted by their open interest and other factors. Here’s how it impacts stock prices:
- Positive GEX: When GEX is positive, market makers tend to buy stocks as prices fall and sell stocks as prices rise. This creates a stabilizing effect, reducing volatility.
- Negative GEX: When GEX is negative, market makers do the opposite—they sell as prices fall and buy as prices rise. This amplifies volatility and can lead to sharp price movements.
Why Should You Care About GEX Gamma Data?
If you’re a trader or investor, GEX Gamma Data can be a valuable tool for understanding market behavior. It can help you:
- Identify potential turning points in the market.
- Prepare for volatility spikes during negative GEX conditions.
- Optimize your trading strategies based on market makers’ hedging activities.
By keeping an eye on GEX Gamma Data, you can align your trades with the broader market dynamics and reduce your exposure to unnecessary risks.
Who Uses GEX Gamma Data?
GEX Gamma Data isn’t just for professional traders or hedge funds—it’s a tool that anyone can use to gain deeper insights into the stock market. Here’s a breakdown of who typically uses it:
- Institutional Investors: Large investors use GEX data to understand market sentiment and adjust their portfolios accordingly.
- Day Traders: Short-term traders rely on GEX data to predict price movements and volatility.
- Options Traders: For those trading options, GEX is a critical metric for managing risk and maximizing returns.
- Market Analysts: Analysts use GEX Gamma Data to explain and forecast market trends.
No matter your level of experience, understanding GEX Gamma Data can give you a competitive edge in the market.
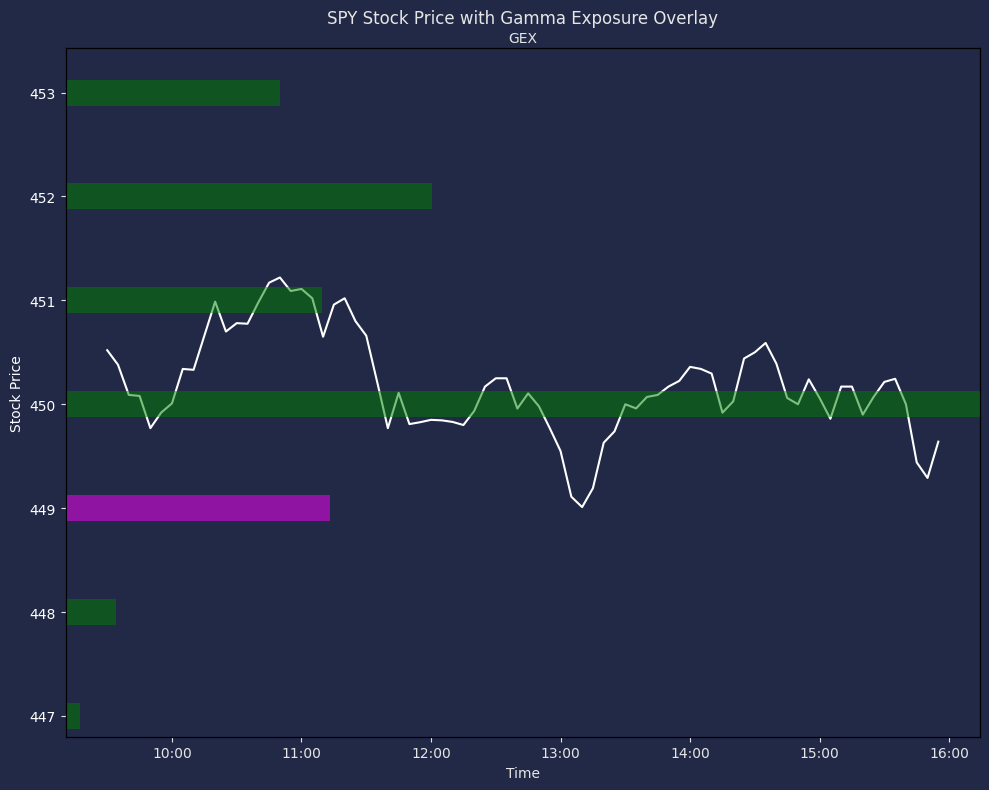
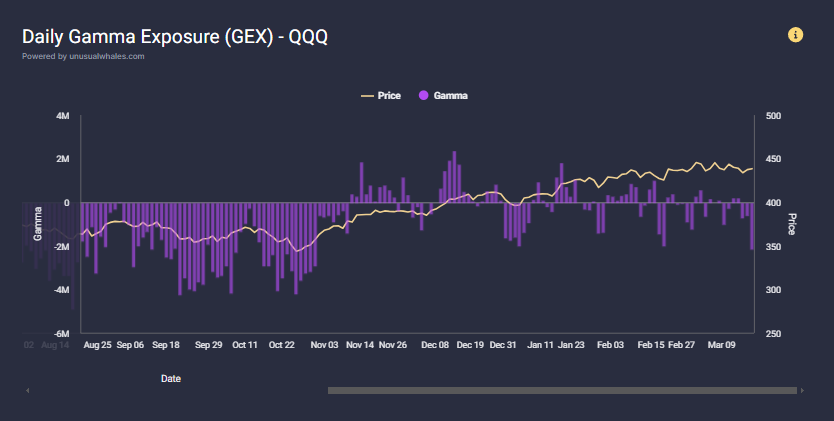
How to Read GEX Gamma Data Charts
GEX Gamma Data charts might look intimidating at first, but they’re relatively simple once you know what to look for. Here’s a step-by-step guide:
- Identify Positive vs. Negative GEX: Look for areas of the chart where GEX is above or below zero. Positive GEX indicates stability, while negative GEX signals potential volatility.
- Watch for Extreme Values: Extreme positive or negative GEX values can signal significant market turning points.
- Track Changes Over Time: Analyze how GEX values have changed over days or weeks to identify emerging trends.
By studying these charts regularly, you can develop a better understanding of market dynamics and make more informed trading decisions.
Tools to Track GEX Gamma Data
Tracking GEX Gamma Data has become easier thanks to advanced tools and platforms. Here are some of the best options:
- SEMrush: Known for its SEO tools, SEMrush also offers features that can help traders analyze market trends, including GEX-related metrics.
- Ahrefs: While primarily an SEO tool, Ahrefs can be used to gather insights into market-related keywords and trends, helping you understand the broader context of GEX.
- SpotGamma: A dedicated platform for analyzing gamma and options data, SpotGamma is a go-to resource for GEX Gamma Data.
- ThinkOrSwim by TD Ameritrade: This platform provides detailed options analytics, including gamma exposure.
- Bloomberg Terminal: A professional tool for market analysis, offering in-depth data on options, gamma, and other metrics.
These tools can help you stay on top of GEX Gamma Data and make better-informed trading decisions.
GEX Gamma Data in Bear Markets
In bear markets, GEX Gamma Data often becomes negative, which means market makers’ hedging activities can amplify price declines. Understanding this can help you avoid panic-selling and even identify buying opportunities when prices are at their lowest.
GEX Gamma Data in Bull Markets
In bull markets, GEX Gamma Data tends to be positive, creating a stabilizing effect that supports steady price increases. Traders can use this information to ride the upward momentum with greater confidence.
Is GEX Gamma Data the Secret to Trading Success?
While GEX Gamma Data is a powerful tool, it’s not a magic solution. Successful trading requires a combination of factors, including market knowledge, risk management, and discipline. GEX can enhance your strategies, but it’s only one piece of the puzzle.
GEX Gamma Data FAQs for Beginners
Q: Is GEX Gamma Data only for options traders?
A: No, while GEX is primarily derived from options data, it’s useful for anyone interested in understanding market behavior.
Q: How often should I check GEX Gamma Data?
A: It depends on your trading style. Day traders might check it daily, while long-term investors can review it weekly or monthly.
Q: Can GEX Gamma Data predict market crashes?
A: While it can signal increased volatility, it’s not a crystal ball. Use it alongside other tools and analyses.
The Bottom Line
GEX Gamma Data is a valuable resource for traders and investors who want to understand the forces driving stock market movements. By analyzing gamma exposure, you can anticipate volatility, identify potential turning points, and make more informed decisions.
Whether you’re a beginner or an experienced trader, incorporating GEX Gamma Data into your market analysis can give you a significant edge. Remember, the stock market is complex, but with the right tools and knowledge, anyone can navigate it successfully. Keep learning, stay informed, and use GEX Gamma Data to your advantage!