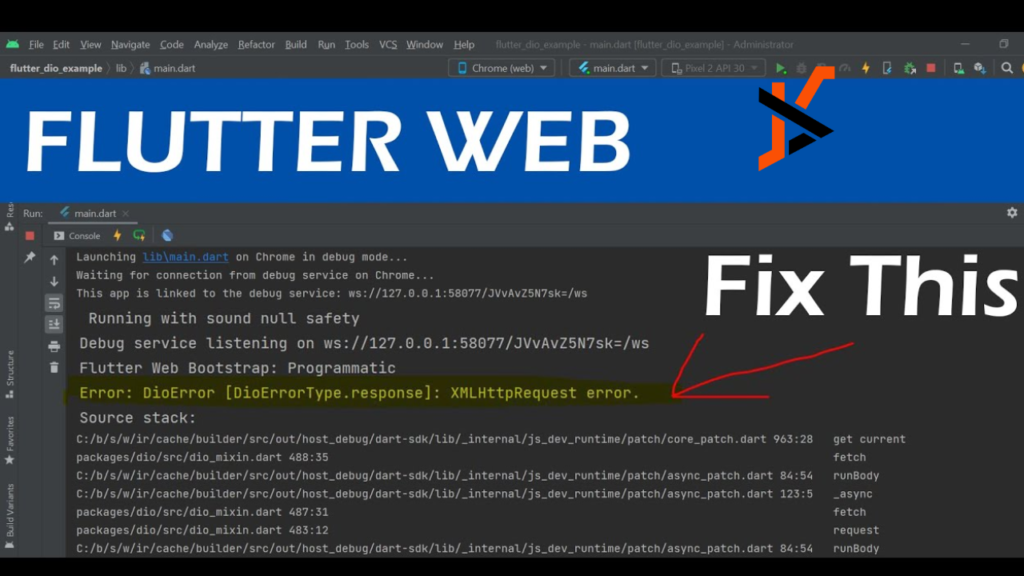
With Flutter, Google’s open-source UI toolkit, developers can create stunning web and mobile applications using a single codebase. However, debugging Flutter web problems can be difficult because online development is a unique context. After all, online development is a unique context. This post will examine essential techniques for debugging Flutter web failures, emphasising Flutter web errors and the Flutter web debugger.
Universal Flutter Web Errors
Runtime exceptions and build problems are only two of the many faults of Flutter web applicationsl.; JavaScriptpt interop issues, and layout challenges from disparate rendering engines are standard errors. Identifying these typical problems is the first step toward efficient debugging.
Using the Flutter Web Debugger
The Flutter web debugger is a vital instrument for diagnosing and correcting mistakes. You can analyze and debug a Flutter web application using browser developer toolsit’sle it’s running. Flutter web apps may be used with both the Firefox and Chrome developer tools.
To access the debugger, run your Flutter web application using flutter run -d chrome or flutter run -d web-server. Once the application runs, open thebrowser’ss developer tools (F12 or right-click and select””Inspec””).
Leveraging Console Logs
Console logs are crucial for understanding the behaviour of your Flutter web application. Use print() statements in your Dart code to log information to the browser console. This helps track the flow of execution and inspect the values of variables at different stages.
Monitoring the console output provides immediate feedback on the application’s state and can help identify where problems occur.
Debugging Layout Issues with the Flutter Inspector
The Flutter Inspector is a powerful tool for visualizing the widget tree and understanding the layout. When debugging layout issues in a Flutter web application, the inspector lets you see how widgets are rendered and interact.
To use the Flutter Inspector, open the DevTools from the command line by running Flutter pub global run dev tools. Then navigate to http://127.0.0.1:9100 in your browser and connect to your running application. The inspector helps diagnose issues with widget positioning and constraints.
Handling JavaScript Interop Errors
Flutter web applications often interact with JavaScript, which can introduce errors. Use try-catch blocks to handle potential JavaScript interop issues gracefully.
Additionally, ensure that your JavaScript code is correctly loaded and does not conflict with other scripts on the page.
Analyzing Network Errors
Network errors are common in web applications due to the asynchronous nature of HTTP requests. Use the browser’s nbrowser’snel to inspect requests and responses. Look for issues such as incorrect URLs, CORS policy violations, and server errors.
To debug network errors, ensure that your API endpoints are correct and accessible and that your application handles different HTTP status codes appropriately.
Using Source Maps
Source maps are vital for debugging minified and transpiled code in web applications. They map the compiled JavaScript code back to the original Dart code, making it easier to understand and debug.
Ensure source maps are generated by setting the –source-maps flag when building your Flutter web application. This lets you see your original Dart code in the browser’s developer tbrowser’sset breakpoints accordingly.
Conclusion
Debugging Flutter web errors requires a combination of tools and strategies tailored to the web environment. Developers can effectively identify and resolve issues by understanding common Flutter web errors, leveraging the Flutter web debugger, using console logs, and utilizing the Flutter Inspector. Handling JavaScript interop errors, analyzing network errors, and using source maps further enhance debugging. These strategies will help you maintain a smooth and efficient development workflow, ensuring robust and error-free Flutter web applications.

