
Prometheus is a powerful open-source monitoring system that works seamlessly with MikroTik’s RouterOS. Designed for flexibility and scalability, it allows users to collect, analyze, and visualize network performance metrics. In this guide, we’ll explore what Prometheus RouterOS is, why you should use it, and how to set it up, making it accessible to everyone—even beginners!
What Is Prometheus RouterOS?
Prometheus RouterOS refers to the integration of Prometheus, an open-source monitoring tool, with MikroTik RouterOS devices. RouterOS is the operating system used by MikroTik routers, known for their flexibility, reliability, and wide-ranging networking features. By connecting Prometheus with RouterOS, you can track network performance, monitor device metrics, and ensure the health of your IT infrastructure in real-time.
Prometheus acts as the brain of the monitoring process. It collects time-series data, stores it efficiently, and uses an advanced query language (PromQL) to help you analyze the metrics. When integrated with RouterOS, it becomes a powerful solution for network administrators who want to track traffic, CPU usage, memory, and much more.
Why Use Prometheus with RouterOS?
Combining Prometheus with RouterOS is like supercharging your network monitoring capabilities. Here are some reasons why this combination is so popular:
- Real-Time Monitoring: Prometheus collects metrics from RouterOS devices in real-time, giving you up-to-date insights into your network’s performance.
- Customizable Alerts: Configure Prometheus to send alerts based on specific conditions, like high CPU usage or unusual network activity. This ensures you can respond quickly to issues.
- Scalability: Whether you’re monitoring a single router or managing a large network, Prometheus scales effortlessly to meet your needs.
- Open-Source Flexibility: Both Prometheus and RouterOS are highly customizable, allowing you to tailor them to your specific requirements.
- Cost Efficiency: Prometheus is open-source and free to use, making it an affordable option for network monitoring.
How to Set Up Prometheus with RouterOS (Easy Steps)
Setting up Prometheus with RouterOS might seem daunting at first, but it’s actually straightforward if you follow these steps.

Install Prometheus
- Download Prometheus: Visit the and download the latest version for your operating system.
- Install Prometheus: Follow the installation instructions for your system. This typically involves extracting the files and running the prometheus executable.
- Configure Prometheus: Edit the prometheus.yml file to include the details of your RouterOS device. For example:
- yaml
- CopyEdit
- scrape_configs:
- – job_name: ‘routeros’
- static_configs:
- – targets: [‘192.168.88.1:9100’]
- Run Prometheus: Start the Prometheus server using the command line:
- bash
- CopyEdit
- ./prometheus –config.file=prometheus.yml
Configure RouterOS for Monitoring
- Enable SNMP on RouterOS: Prometheus relies on SNMP (Simple Network Management Protocol) to collect data. To enable SNMP on your RouterOS device:
- Log in to the RouterOS interface.
- Go to IP > SNMP and enable the service.
- Set the community string (e.g., public) and restrict access to trusted IPs.
- Install SNMP Exporter: Prometheus doesn’t directly support SNMP, so you need an SNMP Exporter. Download and configure the SNMP Exporter to translate SNMP data into a format Prometheus can understand.
- Link RouterOS to SNMP Exporter: Add your RouterOS device’s IP address to the SNMP Exporter configuration file.
Test Your Setup
- Open the Prometheus web interface by navigating to http://localhost:9090 in your browser.
- Use PromQL (Prometheus Query Language) to query your RouterOS metrics. For example:
- promql
- CopyEdit
- node_cpu_seconds_total{instance=”192.168.88.1:9100″}
- Verify that Prometheus is collecting and displaying data from your RouterOS device.
What Can You Monitor with Prometheus RouterOS?
With Prometheus and RouterOS working together, you can monitor a wide range of metrics to ensure your network operates efficiently. Here are some examples:
- CPU and Memory Usage: Track how much of your RouterOS device’s processing power and memory is being used.
- Network Traffic: Monitor upload and download speeds, packet loss, and latency.
- Interface Statistics: Check the performance of specific network interfaces, such as Ethernet or Wi-Fi.
- Resource Usage: Keep an eye on disk space, temperature, and other hardware metrics.
- System Uptime: Ensure your devices are running smoothly without unexpected downtime.
By having these insights, you can proactively address network issues before they become major problems.
Troubleshooting Prometheus RouterOS (Fix Common Issues)
Even with a proper setup, you may encounter some issues while using Prometheus with RouterOS. Here’s how to fix common problems:
- No Metrics Collected:
- Ensure SNMP is enabled on your RouterOS device.
- Verify that the correct IP and community string are configured in the SNMP Exporter.
- Connection Errors:
- Check firewall rules on your RouterOS device and ensure that Prometheus can communicate with it.
- Confirm that the SNMP Exporter and Prometheus are running on the correct ports.
- High Resource Usage:
- If Prometheus is using too much CPU or memory, optimize the scrape interval in the prometheus.yml file. For example:
- yaml
- CopyEdit
- scrape_interval: 30s
Prometheus RouterOS for Beginners (Tips and Tricks)
If you’re new to Prometheus RouterOS, here are some tips to make your experience smoother:
- Start Small: Begin by monitoring a single RouterOS device before expanding to a larger network.
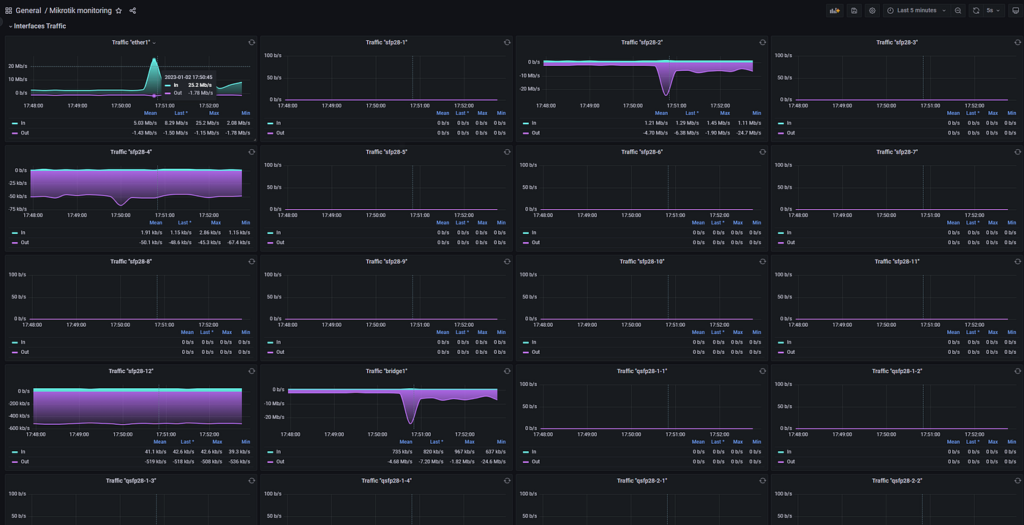
- Use Pre-Built Dashboards: Tools like Grafana can integrate with Prometheus to create stunning, user-friendly dashboards for visualizing your data.
- Leverage Community Resources: The Prometheus and MikroTik communities are active and full of resources, tutorials, and forums where you can ask questions.
Advanced Features of Prometheus RouterOS
Real-Time Alerts
Prometheus can send real-time alerts when specific conditions are met. For example, you can configure alerts for high CPU usage or network congestion. Use Alertmanager, a companion tool, to manage and route these alerts to email, Slack, or other channels.
Custom Dashboards
Integrating Prometheus with Grafana allows you to create customized dashboards. Visualizing metrics like bandwidth usage, device temperature, or network latency becomes much easier with interactive charts and graphs.
Data Storage
Prometheus uses a time-series database to store metrics. This data is compressed and indexed for fast querying. However, for long-term storage, you may need to use a remote storage solution like Thanos or Cortex. These tools extend Prometheus’ capabilities, allowing you to retain metrics for months or years.
The Bottom Line
Prometheus RouterOS is an incredibly powerful combination for network monitoring. It gives you deep insights into your RouterOS devices, helping you maintain optimal performance and troubleshoot issues quickly. Best of all, it’s open-source, scalable, and beginner-friendly. Whether you’re managing a small home network or a large enterprise setup, Prometheus RouterOS can make your life as a network administrator much easier. Start your journey today and unlock the full potential of your network!